Blood Flow Imaging for the Carotid Artery: Vector Flow Imaging vs Conventional Doppler
I. Conventional Doppler
Pulsed Wave Doppler
Pulse Wave Doppler is one of the two methods of Spectral Doppler, recording the blood velocity from a sampling volume. In Pulsed Wave Doppler, the user defines a small area (the sample “volume” or “gate”) within the B-mode image, and the Doppler shifts from that area are recorded. The intermittent sampling of pulsed wave Doppler renders the modality vulnerable to aliasing at higher velocities, especially for distant target areas.
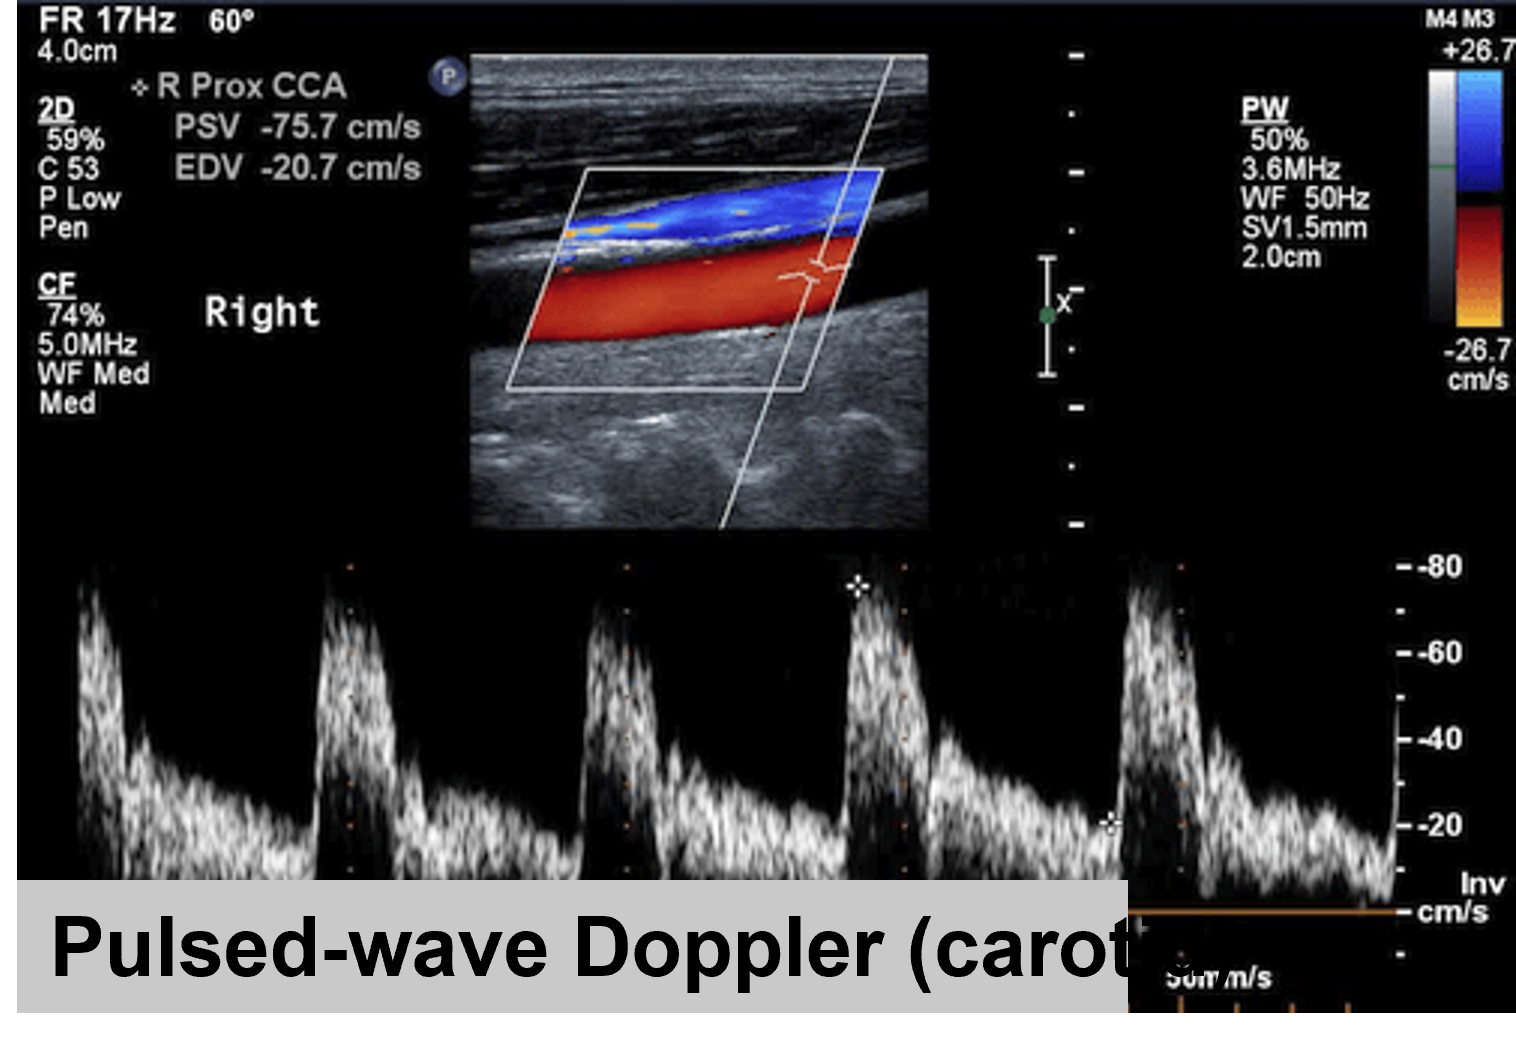
Figure 1. Pulsed-Wave Doppler in the carotid common artery (CCA)
Figure 2. Pulsed-Wave Doppler Acquisition
Color Doppler
Color Doppler Imaging visualizes the blood flow within a defined area. In a similar manner to Pulsed Wave Doppler (PWD), Color Doppler utilizes intermittent sampling of ultrasound waves to determine the Doppler shifts from moving blood. Unlike PWD, CFD simultaneously interrogates multiple sample volumes represented by pixels across an array of scan lines. The resulting flow velocity and direction are color-coded onto a grayscale image, typically with red indicating flow towards the transducer and blue indicating flow away. When the Nyquist limit is reached, aliasing occurs, causing apparent flow direction reversal.
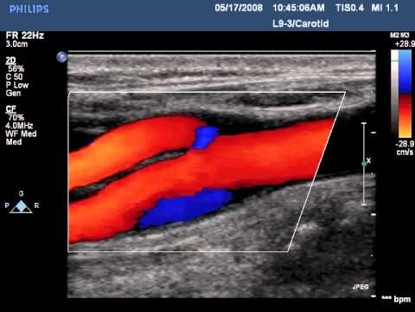
Figure 3. Color Doppler in carotid bifurcation
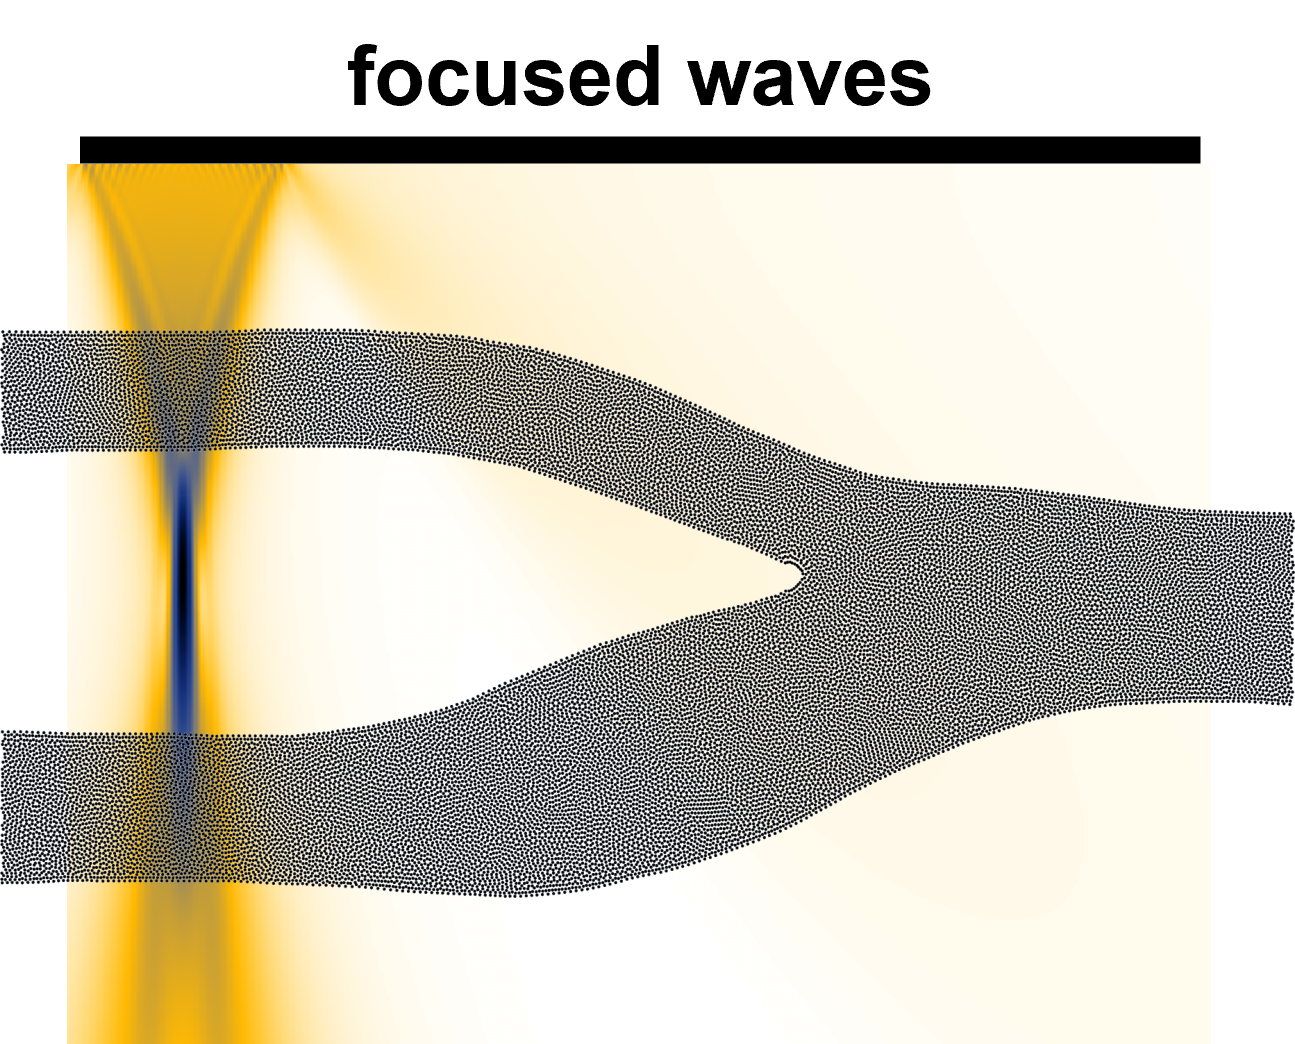
Figure 4. Color Doppler Acquisition in carotid bifurcation
Clinical Applications of Conventional Doppler
Conventional Doppler is widely used in clinical settings for diagnosis and assessment of the carotid stenosis disease. Color Doppler is useful for the detection of areas of abnormal blood flow, as it is possible to target an area of turbulence. Such an area can be further investigated with Pulsed Wave Doppler, with an estimation of the blood velocity along the time.
Limitations
Conventional Doppler has some limitations:
- the acquired velocity is unidimensional, so it cannot capture complex blood flow
- the acquisition is angle-dependent
- the frame rate is relatively low, so it cannot capture transient event
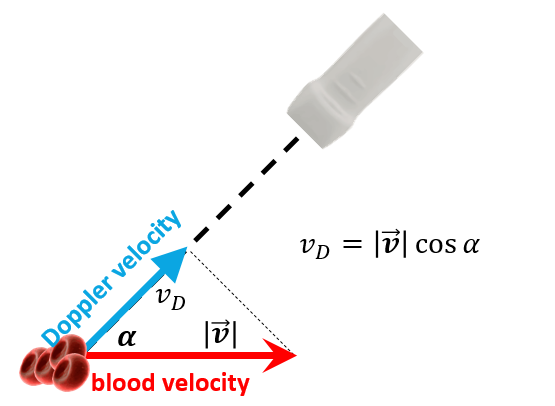
Figure 5. Conventional Doppler is angle-dependant
II. Vector Flow Imaging
Vector Flow Imaging (VFI) offers a novel approach to visualizing blood flow velocity in multiple dimensions, angle-independent. By measuring at least two velocity components, VFI calculates the true flow vector and velocity magnitude, providing spatial and temporal vector information without angle correction. This allows for the determination of velocity vectors, streamline distribution, and vorticity distribution within a vessel. Among the various VFI techniques for vascular applications, three of them have been implemented on commercial systems:
- Transverse Oscillation (TO)
- Plane Wave Imaging (PWI)
- Vector Projectile Imaging (VPI).
These methods are described in the next sections.
Transverse Oscillation
The Transverse Oscillation (TO) method, a type of Vector Flow Imaging (VFI), utilizes a single array transducer and two received beamformers to measure the axial and transverse components of the velocity vector. It can be extended to measure all three dimensions with a third beamformer. The Transverse Oscillation (TO) method uses consecutive ultrasound pulses, similar to conventional Doppler, comparing the pulse-to-pulse differences in received signals to calculate velocity. Based on a conventional acquisition process, the TO technique can be implemented in real-time. However, it typically achieves a relatively low frame rate (15-25 Hz), which may not fully capture all hemodynamic events throughout the cardiac cycle.
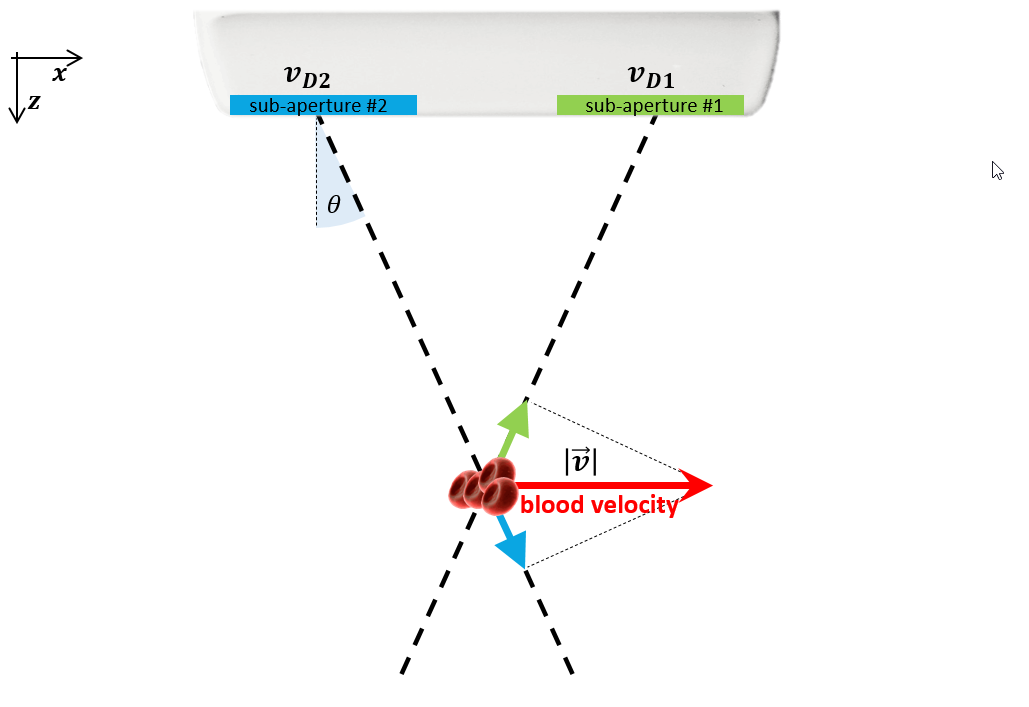
Figure 6. Transverse Oscillation Method for Vector Flow Imaging
Plane Wave Imaging
Plane Wave Imaging (PWI) estimates the two-dimensional vector velocity of blood flow at higher frame rates, enabling better visualization of complex flow patterns. Unlike conventional focused ultrasound beams that generate only one focused beam per transmission, PWI uses a series of single, unfocused beams, providing broader insonification and allowing for the generation of several parallel receiving beams. Although individual images may have low contrast and spatial resolution, coherent compounding of multiple plane wave images significantly improves image quality while maintaining frame rates at least ten times higher than conventional acquisition. Frame rates in PWI-based VFI vary depending on the specific acquisition technique.
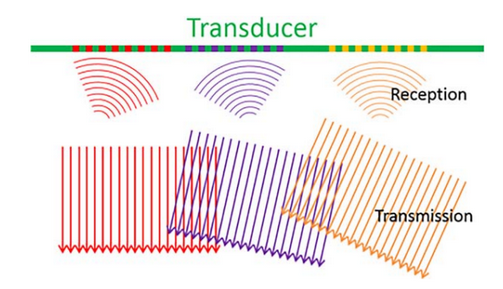
Figure 7. Plane Wave Imaging Method for Vector Flow Imaging
Vector Projectile Imaging
Vector Projectile Imaging (VPI) is a VFI technique that achieves a high frame rate of 416 Hz by deriving true velocity vectors from multidirectional transmission and reception of plane waves. It calculates the real vector velocity, including both magnitude and direction, by combining velocities from a series of steers using a complex angle-compounding algorithm. VPI can utilize continuous Doppler transmission, avoiding transient states and allowing for continuous filtering to remove clutter. Dynamic flow is visualized by continuously updating red blood cell positions based on the calculated velocity. In commercial systems, this high frame rate VFI is often combined with focused wave transmissions interleaved with multi-directional Doppler transmission to generate high-resolution B-mode images.
III. V Flow, a High Frame Rate VFI Commercial System
Presentation
Since 2017, V Flow has been the only High Frame Rate VFI System to be commercially available as a clinical scanner. It implements the Vector Projectile Imaging method and generates of frame rate up to 600 Hz. This high speed enables detailed characterization of complex and disturbed flow patterns. The increased temporal resolution allows for the visualization of all flow events, including transient ones that would otherwise be missed, throughout the entire cardiac cycle. Furthermore, it provides precise measurements of their extent and duration.
Using this approach, blood flow is analyzed over a 1.5-second period, sufficient to study at least one cardiac cycle. Data is acquired at pulse repetition frequencies (PRFs) of 10-15 kHz and high frame rates (400-600 Hz, depending on the specific PRF). The sonographic system then processes this data, producing a sequence of approximately 600-900 images. These images can be displayed at a frame rate of 20-30 Hz and further analyzed frame by frame in slow motion.
Comparison with conventional Doppler
Goddi, Alfredo, et al. “High–frame rate vector flow imaging of the carotid bifurcation in healthy adults: Comparison with color Doppler imaging.” Journal of Ultrasound in Medicine 37(9) (2018): 2263-2275.
Please note that this article is promoting a commercial US device.
Materials and Methods
Carotid bifurcation diameters and flow characteristics of 60 vessels in 60 healthy volunteers were evaluated quantitatively and qualitatively to assess complex flow patterns and their extension and duration. Two experienced radiologists performed all of the US examinations using a Resona 7 system (Shenzhen Mindray BioMedical Electronic Co, Shenzhen, China) equipped with VFI and an L11-3-MHz linear transducer. The standard evaluation included B-mode and color Doppler imaging in longitudinal and transverse views, followed by spectral Doppler imaging and VFI in the longitudinal view. More details in article.
Results
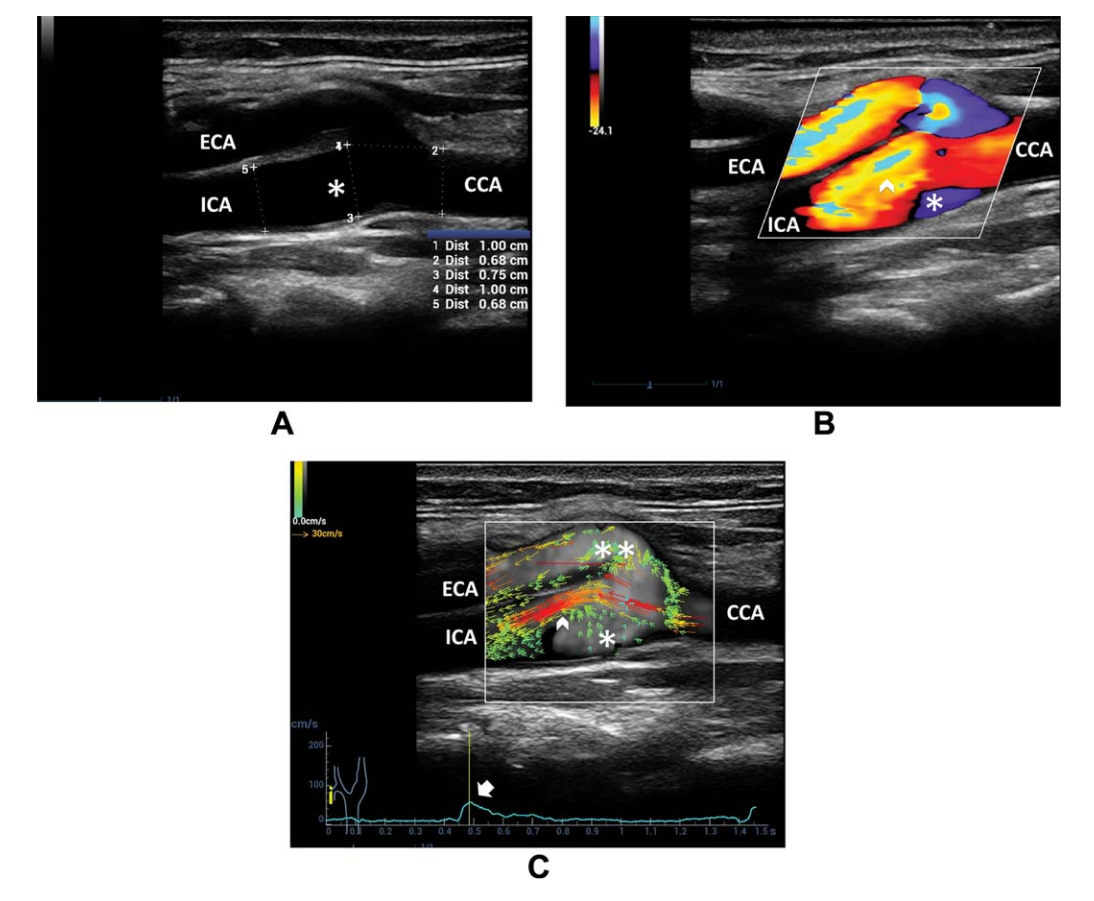
Figure 8. A, B-mode US of the carotid bifurcation shows vessel diameter enlargement from the CCA to ICA sinus B, Color Doppler imaging depicts the high-velocity flow in the ICA sinus near the flow divider (arrowhead) and recirculation on the opposite side (asterisk). C, Vector flow imaging shows the high-velocity red vectors near the ICA flow divider (arrowhead) and multidirectional low-velocity green vectors on the opposite side (single asterisk) and at the external carotid artery (ECA) entrance (double asterisks), starting at the systolic peak (arrow on the velocity-versus-time curve)
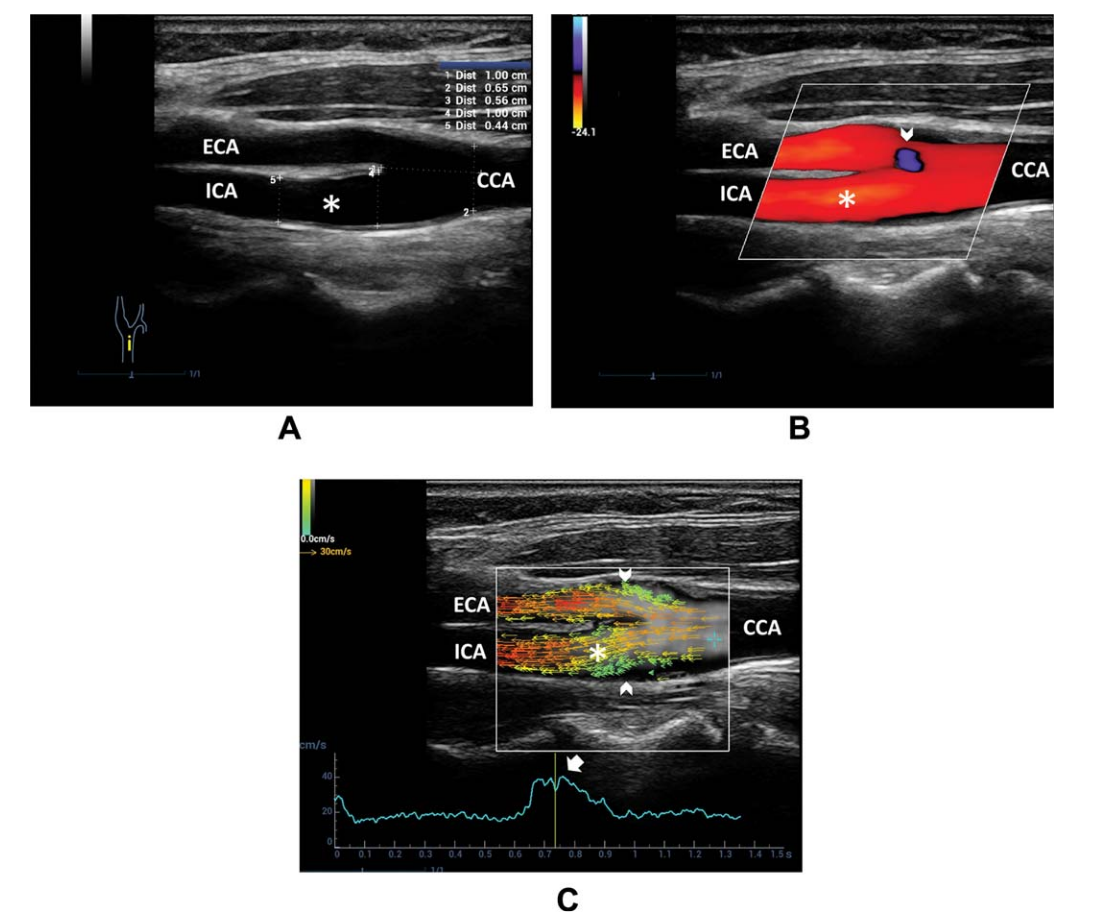
Figure 9. A, B-mode US of the carotid bifurcation indicates a reduction in diameter from the CCA to ICA. B, Color Doppler imaging shows a uniformly colored flow pattern throughout the ICA (asterisk). A small area of an ambiguous signal is seen at the external carotid artery (ECA) entrance (arrowhead). C, Vector flow imaging frame at the systolic peak shows blood flowing upstream through the entire diameter in the ICA sinus.The main flow is depicted by parallel red/orange vectors; a flow separation area, without recirculation, is highlighted by slow green vectors upstreaming near the boundary of the carotid bifurcation.
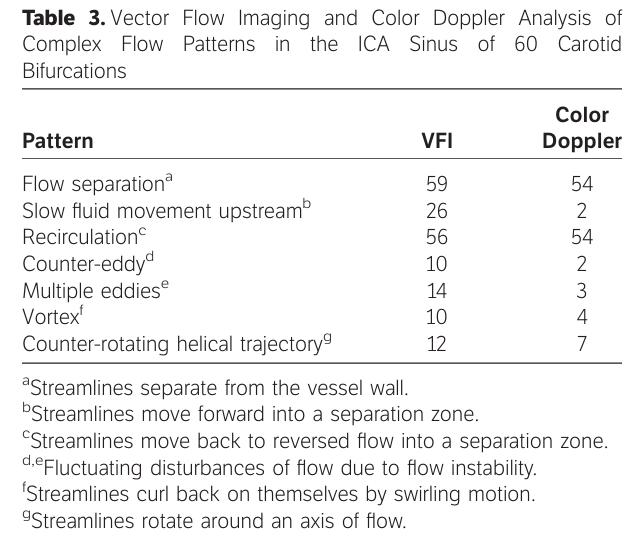
Vector flow imaging allowed more detailed visualization of various complex flow patterns compared with color Doppler imaging (Table 3). Specifically, recognition of forward slow movement into a separation zone was possible in 26 of 60 (43%) versus 2 of 60 (3.3%) cases (Figure 9C). Counter-eddies or multiple eddies were detected in 24 of 60 (40%) versus 5 of 60 (8.3%) cases; vortex flow and a counter-rotating helical trajectory were depicted in 10 of 60 (16.6%) and 12 of 60 (20%) versus 4 of 60 (6.6%) and 7 of 60 (11.6%) cases. Different flow patterns were frequently combined in the same vessel.
Discussion: Clinical Applications of HFR VFI
Vector Flow Imaging (VFI) holds significant promise for clinical applications, particularly in assessing the carotid bifurcation, a common site for arterial plaque development. Since vortex flow patterns are often associated with plaque formation, the ability of VFI to accurately analyze complex blood flow, detect short-lived flow disturbances during the cardiac cycle, and pinpoint the edges of recirculation zones becomes crucial for risk stratification in atherosclerotic disease based on wall shear stress assessment.
The improved spatial and temporal resolution of VFI explains its superior performance compared to color Doppler imaging in detecting fluctuating flow disturbances such as eddies and complex flow behaviors like vortices and helical trajectories. These capabilities allow VFI to precisely identify both recirculation zone boundaries and areas of flow instability.
These initial findings suggest that high-frame rate VFI may represent a valuable new ultrasound approach that surpasses color Doppler imaging in flow estimation. However, further research is needed in pathological settings to fully validate VFI’s potential clinical benefits.
Another possible further investigation could be to compare the complex events detection to other Vector Flow Imaging commercial devices, instead of Color Doppler Imaging.